In this article, we will describe our project and the process of making it.
Why?
While we were in the eleventh grade our physics teacher came up to us and asked us if we could design a Doppler effect demonstration kit. We immediately agreed. She gave us some requirements she wanted and we began brainstorming ways to accomplish them.
What is the Doppler effect?
If you already know the doppler effect, you can skip this section.
Doppler effect is an apparent change in the frequency of a wave when a source is moving relative to a listener. When a source is moving, it compresses the waves in front of it, so the frequency appears higher, while the opposite happens behind the source. This can be seen in the illustration.

Illustration By Charly Whisky 18:20, 27 January 2007 - Own work, CC BY-SA 3.0, https://commons.wikimedia.org/w/index.php?curid=1606823
You have probably already experienced the doppler effect when an ambulance or police car (with a siren) was passing by you. You could hear a frequency change when it was coming towards you and away from you. You can also hear that on this small audio.
Doppler effect can be calculated using a simple equation:
$$ f=\left({\frac {c\pm v_{\text{r}}}{c\pm v_{\text{s}}}}\right)f_{0} $$
Where:
- f - observed frequency
- f0 - emitted frequency
- c - propagation speed of waves in the medium
- vr - speed of the receiver relative to the medium
- vs - speed of the source relative to the medium
Basic idea
Our idea was to have two carts that could roll along some tracks. The transmitter would be mounted on one cart, and the receiver would be mounted on another. We would move one of the carts and observe the difference in frequency, which we could use to calculate the speed. The main point was to make it in such a way that our classmates could use it to learn about the doppler effect. Our teacher wanted this to be an exercise for them. They would have to calculate the speed alone and then ensure it matches the speed measured.
Transmitter
The ultrasonic transducers are optimized to work on around 41 kHz, so we had to get a 41 kHz square wave from the Arduino. We made use of a timer to get the signal. The code to get the timer working was quite simple.
const byte LED = 3;  // Timer 2 "B" output: OC2B

const long frequency = 41000L;  // Hz

void setup()
{
 pinMode (LED, OUTPUT);

 TCCR2A = _BV (WGM20) | _BV (WGM21) | _BV (COM2B1); // fast PWM, clear OC2B on compare
 TCCR2B = _BV (WGM22) | _BV (CS21);         // fast PWM, prescaler of 8
 OCR2A =  ((F_CPU / 8) / frequency) - 1;    // zero relative
 OCR2B = ((OCR2A + 1) / 2) - 1;             // 50% duty cycle
 }  // end of setup

void loop() { }
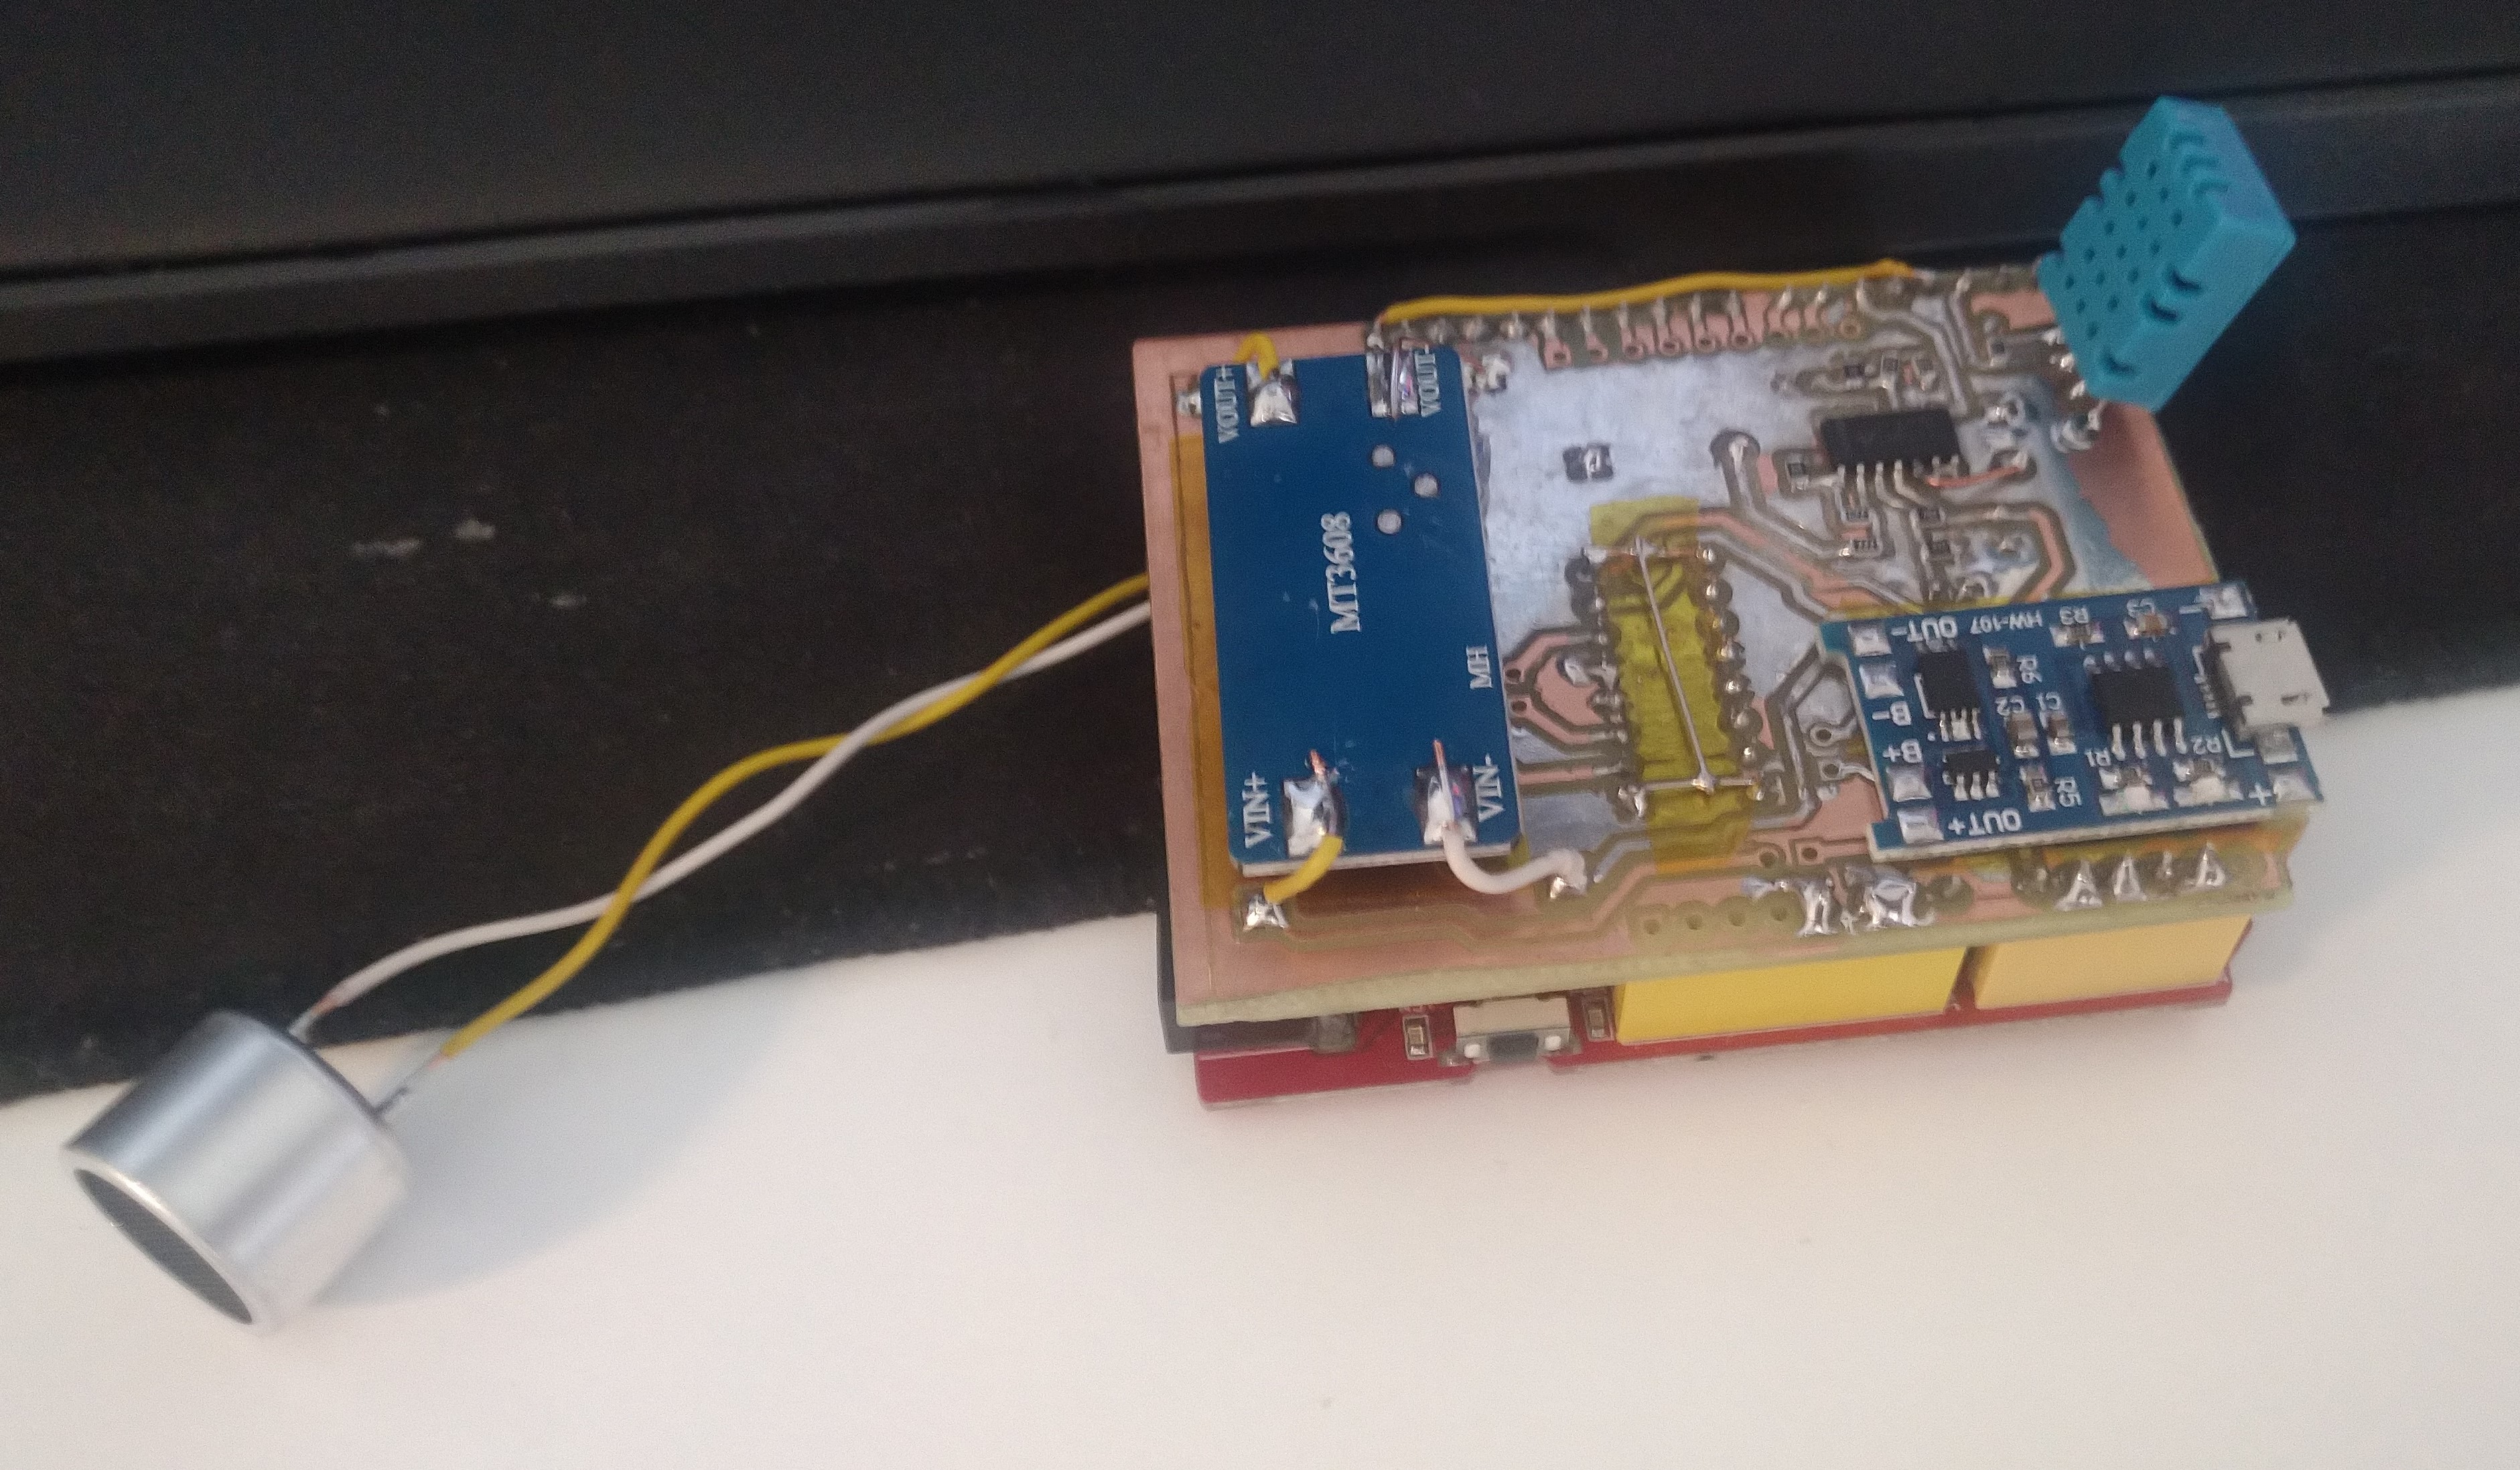
Once we got that functioning, we decided to improve it with an H-bridge. The main idea behind that was to get the signal on the transducer from 0 - 5 Volts peak-to-peak, to -5 - 5 Volts peak-to-peak. This showed to be better for detecting the signal on the receiver. After we got the basics functioning, we decided to wire up a lipo battery protection board and a boost converter. We designed the PCB and CNC-ed a few pieces.
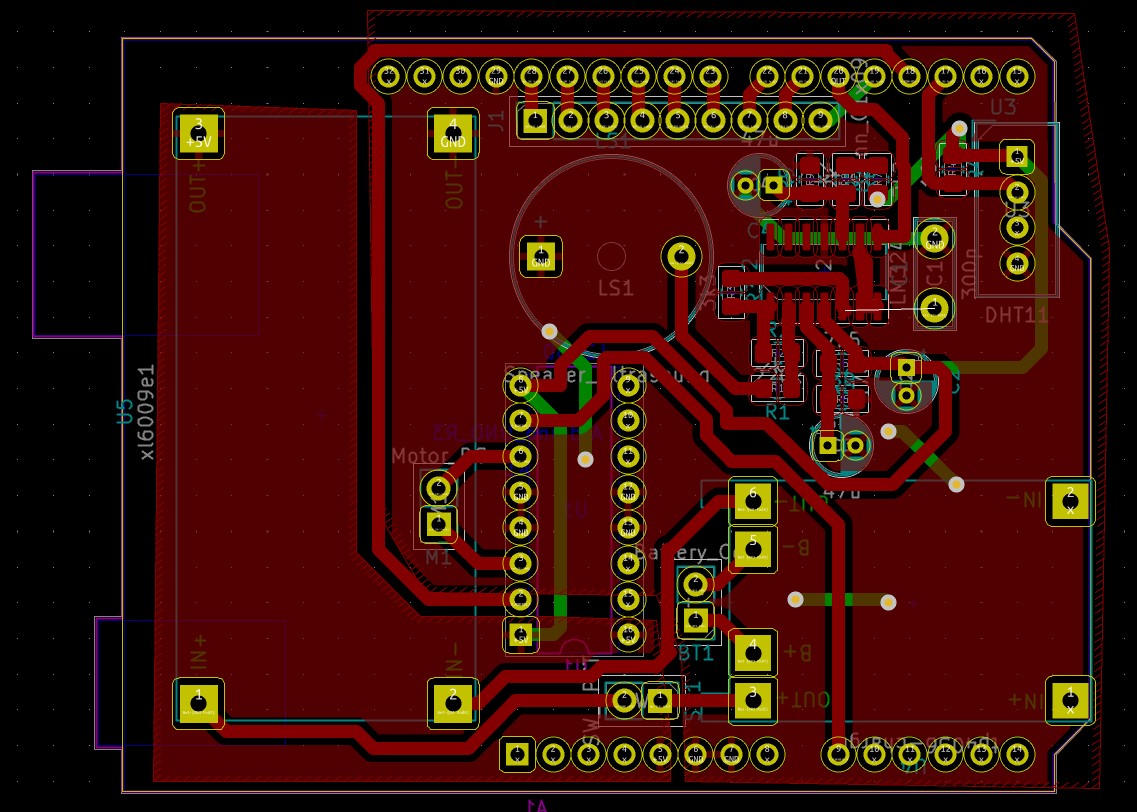
Picture of transmitter PCB
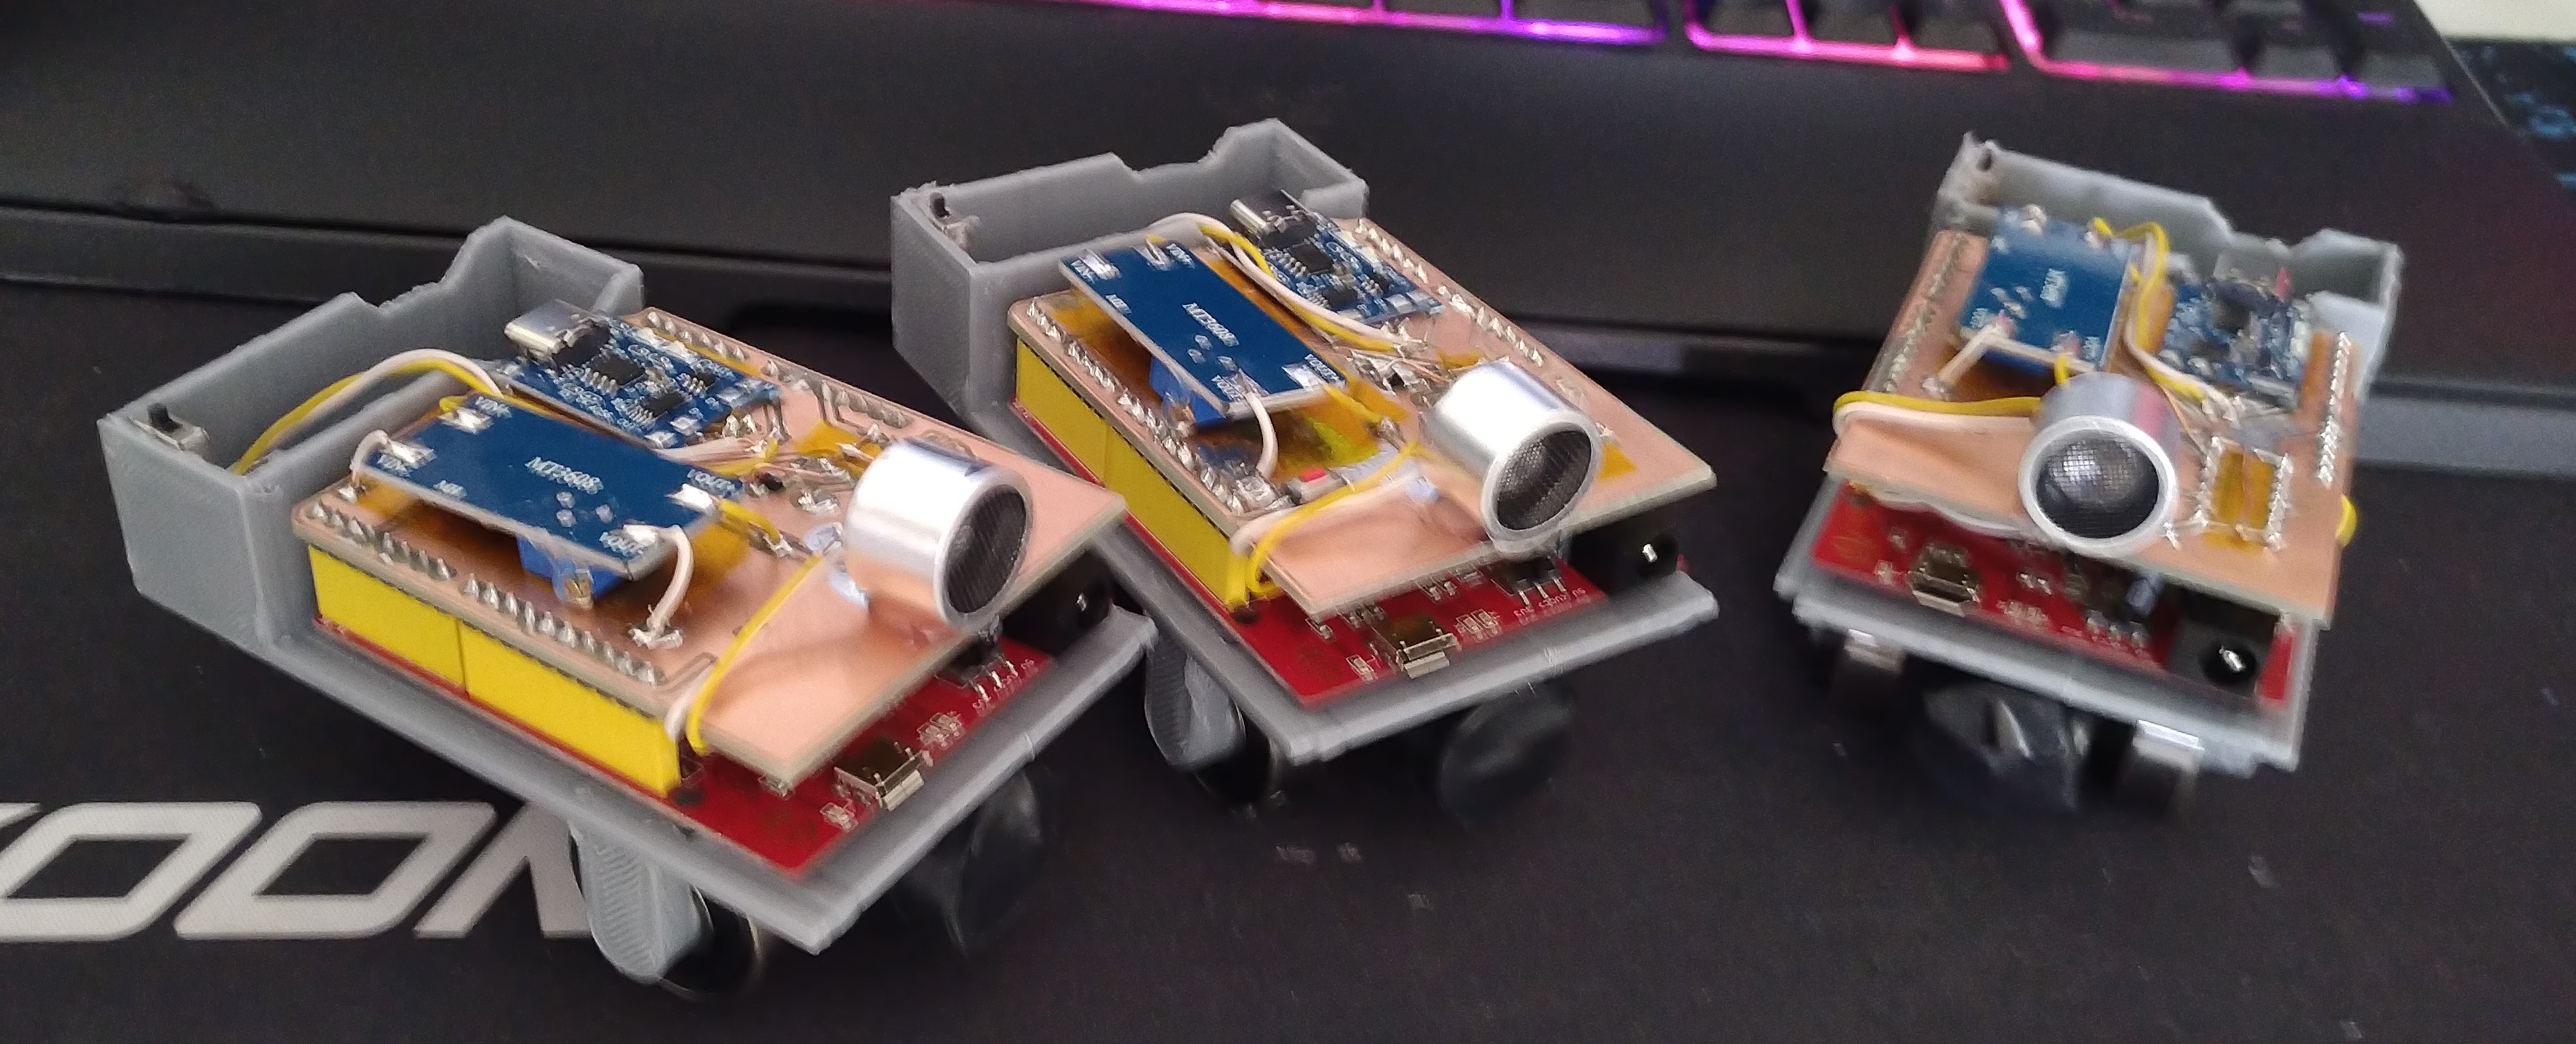
When the PCB assembly was over, we put the board in place and completed building a transmitter cart.
Receiver
Once we got the transmitter working, we began working on the receiver. We did not have much experience working with operational amplifiers, so we initially had to do some prototyping. We had to experiment a bit with amplifiers to get a bit better knowledge.
The main problem, the ultrasonic receivers got a weak signal with a peak-to-peak voltage of around 80 mV. This meant we needed a way to “boost” the signal so Arduino could read it. Once we decided on a gain, we had to filter out the signal a bit better. An issue we then encountered was there was a lot of random noise from the surroundings. Since the noise was predominantly high frequency, we added a low-pass filter. The signal was still a sinusoidal wave, but we needed a square wave for the Arduino because we wanted it to detect rising edges and count them. We implemented a comparator circuit using one of the op-amps inside LM324. Our op-amp configuration resulted in a square wave that we could easily feed into Arduino.
Our teacher also fancied a motor on the receiver so the students could make it move with a constant speed to get repeatable results. Because we wanted to make the motor spin in both directions, we used a simple L293 H-bridge to control it.
Since the formula for the doppler effect uses the initial speed of sound in the air we needed a way to calculate it. Sound speed is going to change depending on various factors of which the most important are temperature and humidity (because that are the variables that change air density the most). To collect the readings, we used a simple DHT-11 sensor, which can get us good enough results for our application.

As you can see on the schematic, we used a lithium polymer cell to power the device. Because the operational amplifier filters were designed to work on 5 Volts, we had to convert the 3-4.2 V coming from the battery to 5 Volts. We used a cheap boost converter to do the trick, to be precise we utilized XL6009.
After we got the prototype working, it was time to build the “production” version. Our teacher wanted multiple kits, so we determined it would be best if we made a PCB to mount everything on. The whole design was not complicated, so we got it working quickly. We used surface mount components where we could, for instance, we only used 0805 SMD resistors.
We had to CNC route the board next, which took us a few tries because we encountered some issues with our CNC settings. Once we managed to get the settings right, we effortlessly routed a few PCBs, after which it was time for the next step: assembly and soldering.
The board was easy to solder after we placed the components in their places. It was only a bit tricky to get the LM324 placed and soldered correctly.
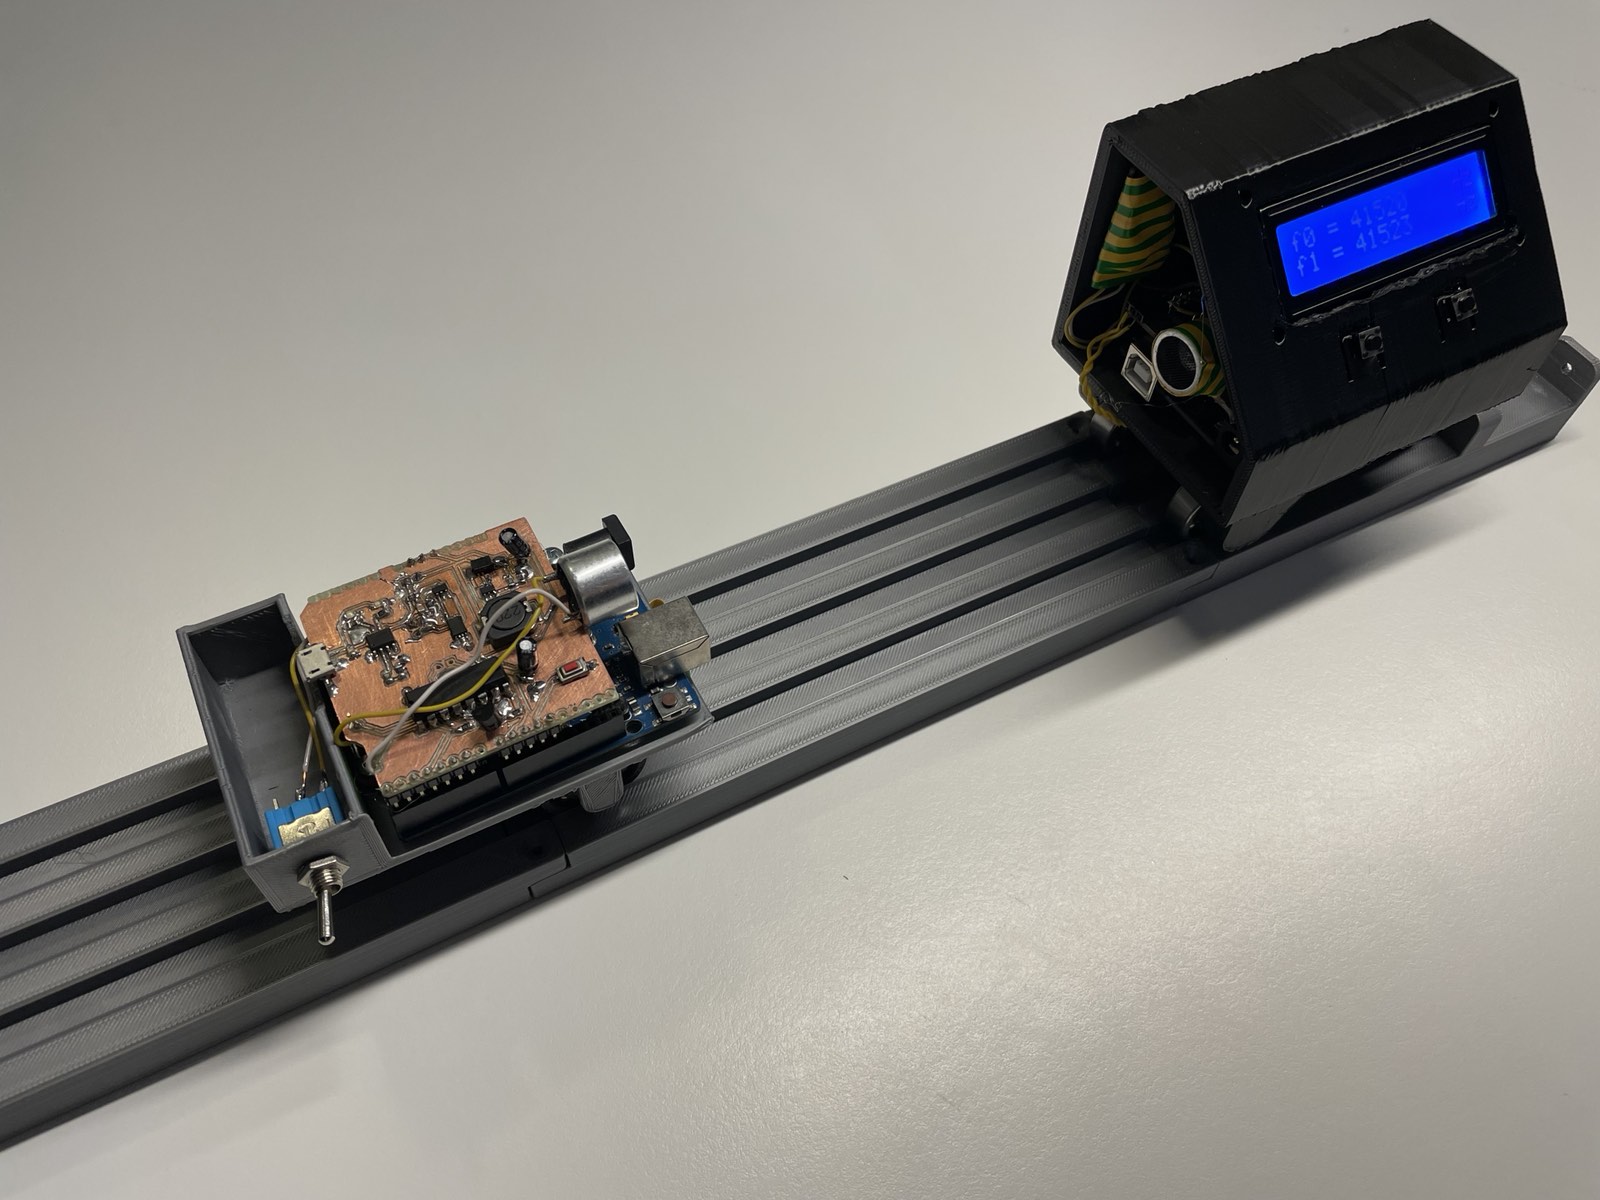
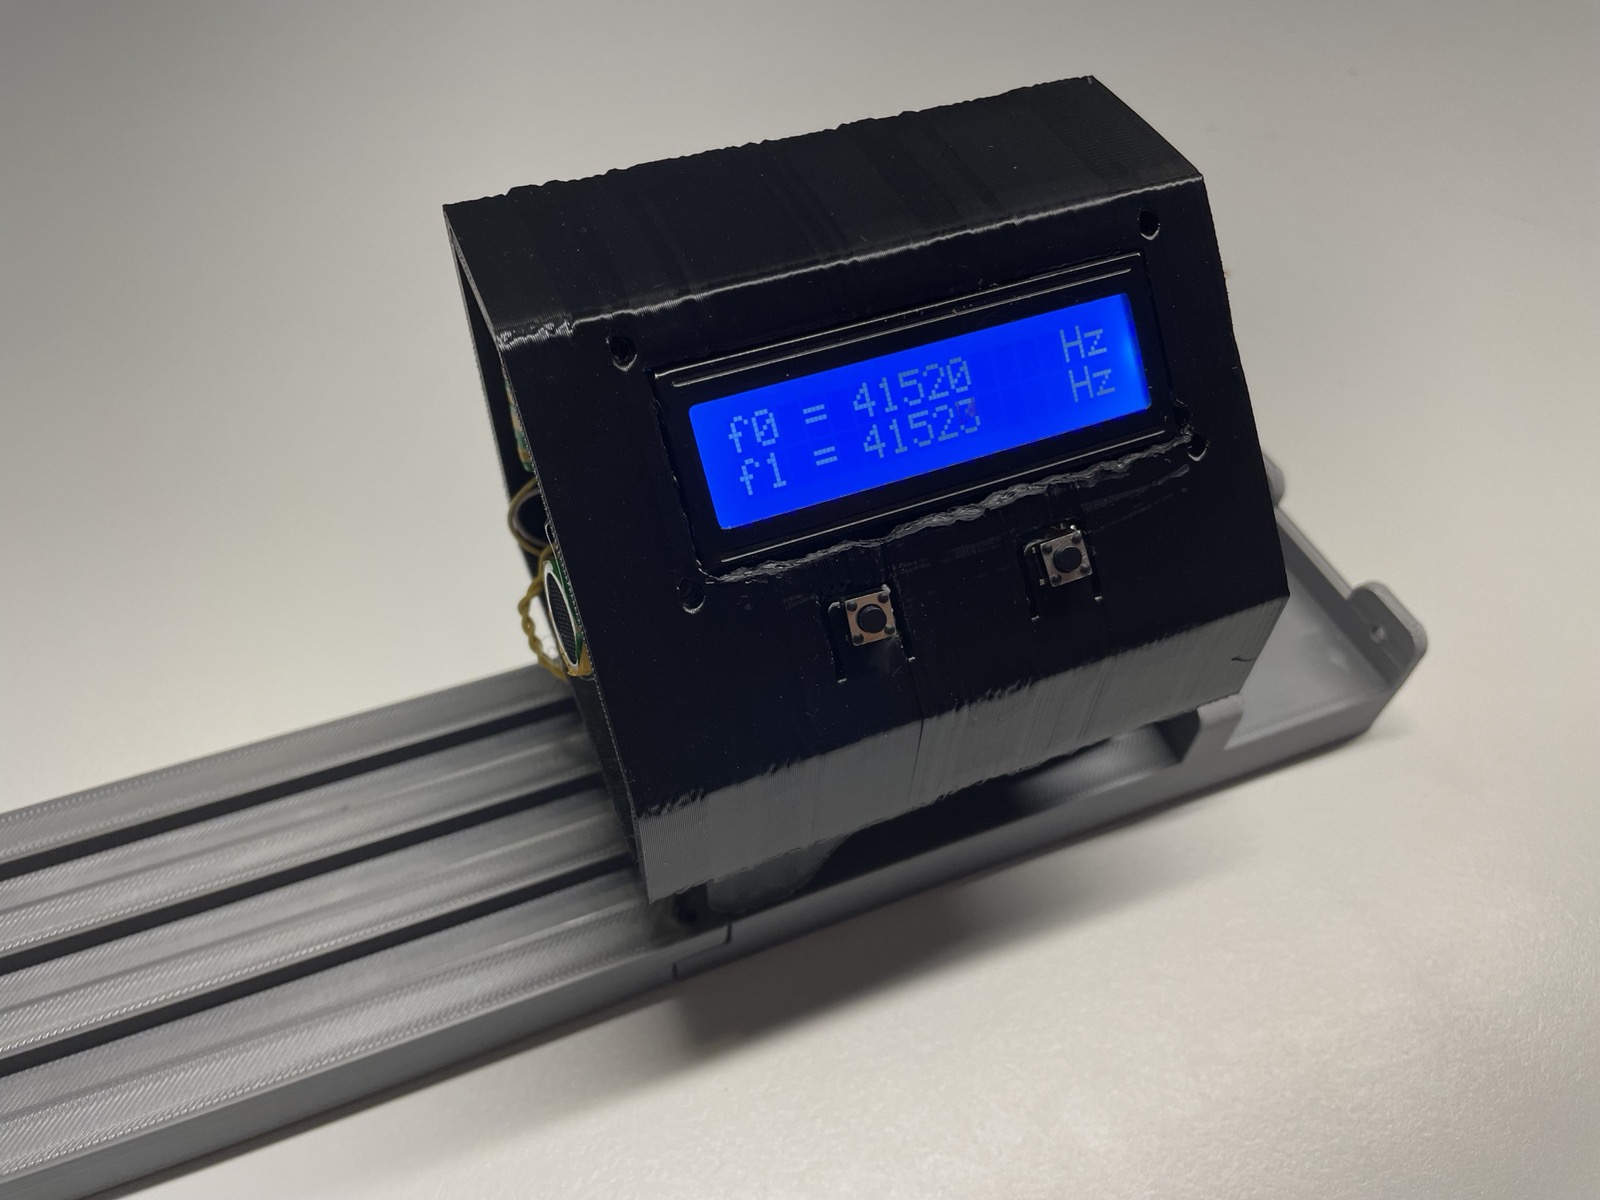
Once the PCB was finished, we had to put it into the enclosure with the rest of the components. We had to wire some buttons and a switch, along with ten wires for an LCD Display. The display was used to present the current reading and calculated speed values.
Mechanical design
Overall, the design was quite simple. Our first idea was to have the receiver in a box and still.
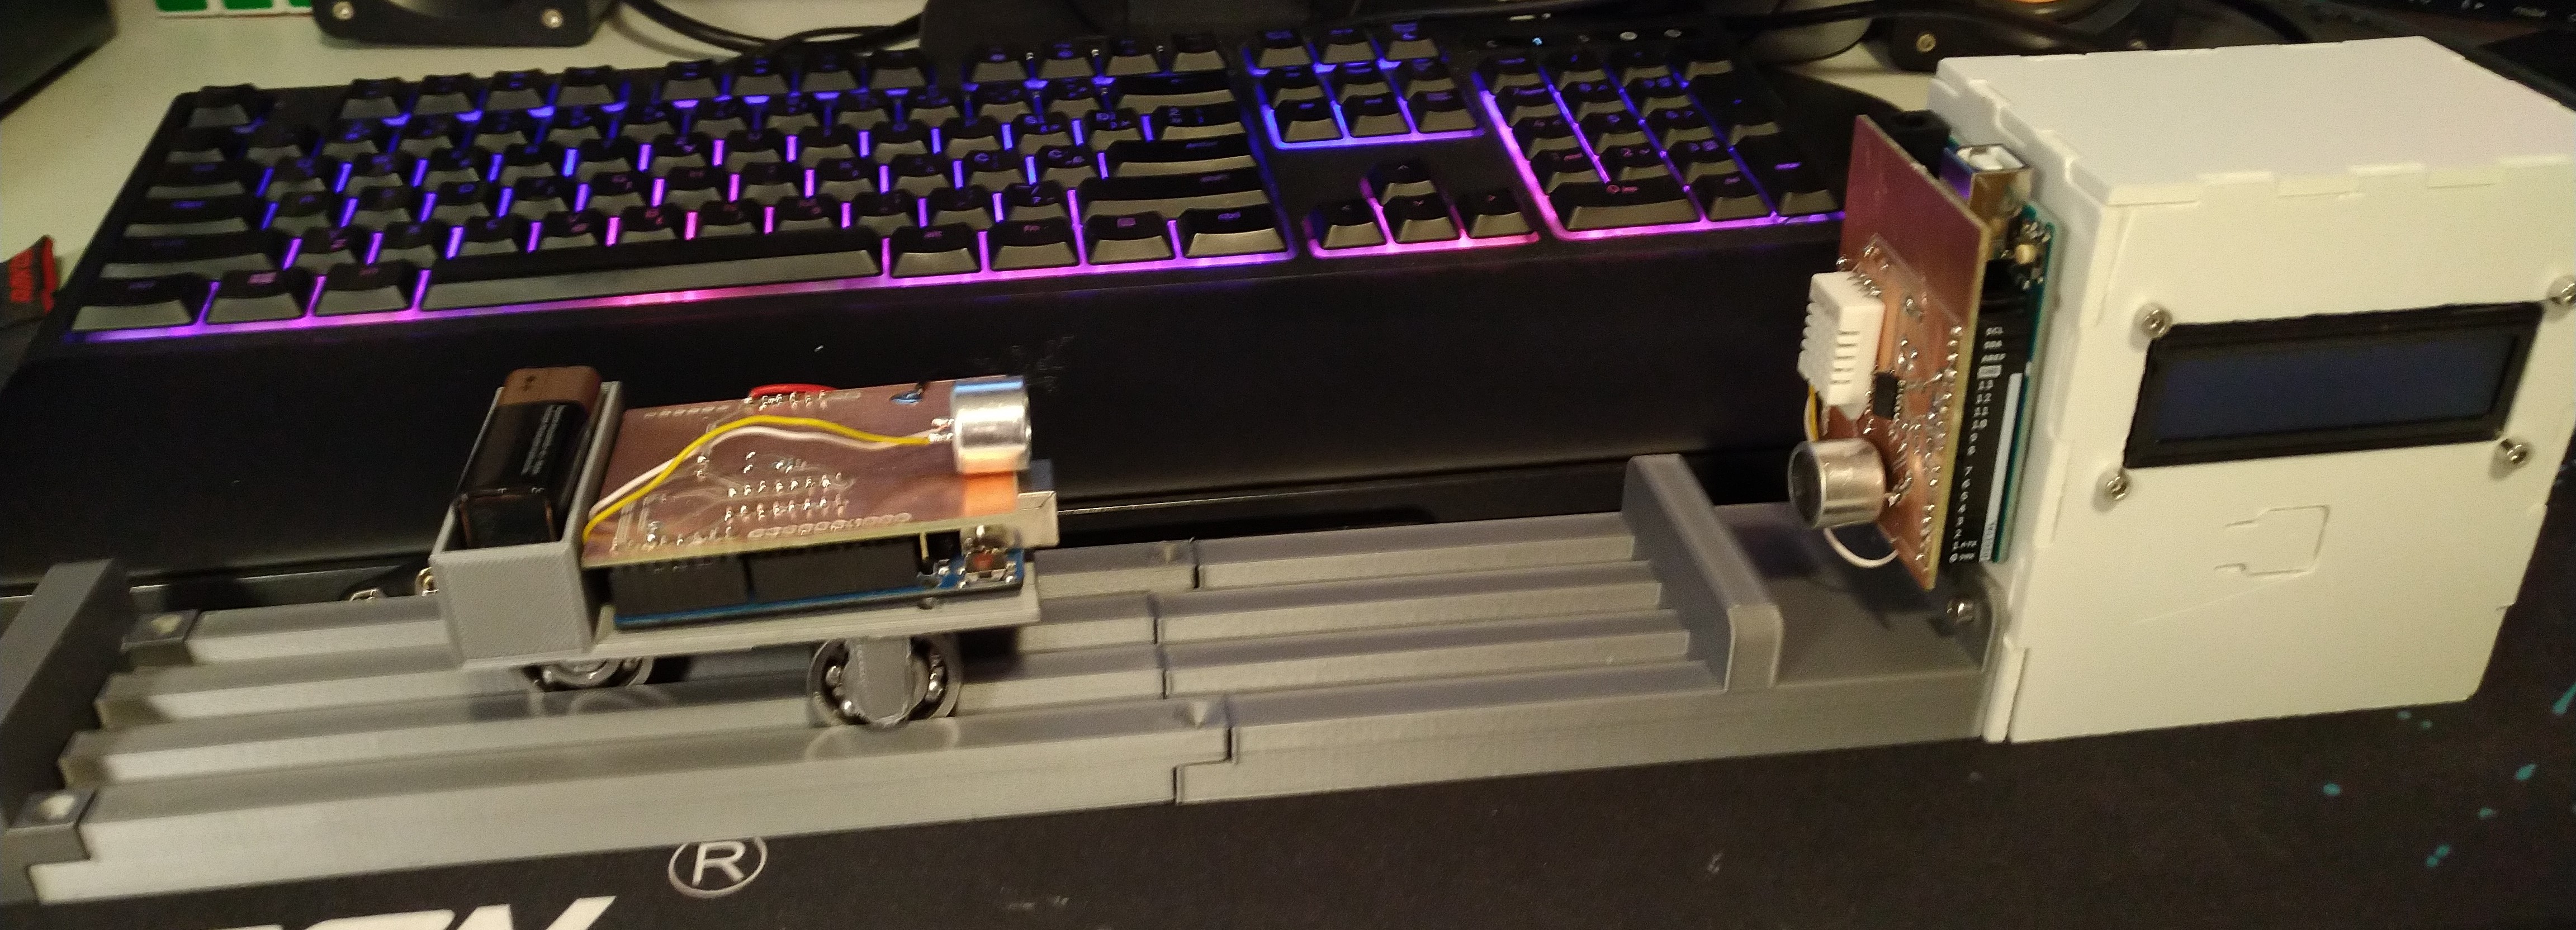
After we built the first prototype and after some consultation with our teacher, we decided to have the receiver also on the tracks.
The carts used ball bearings to roll inside tracks, as you can see on the design:
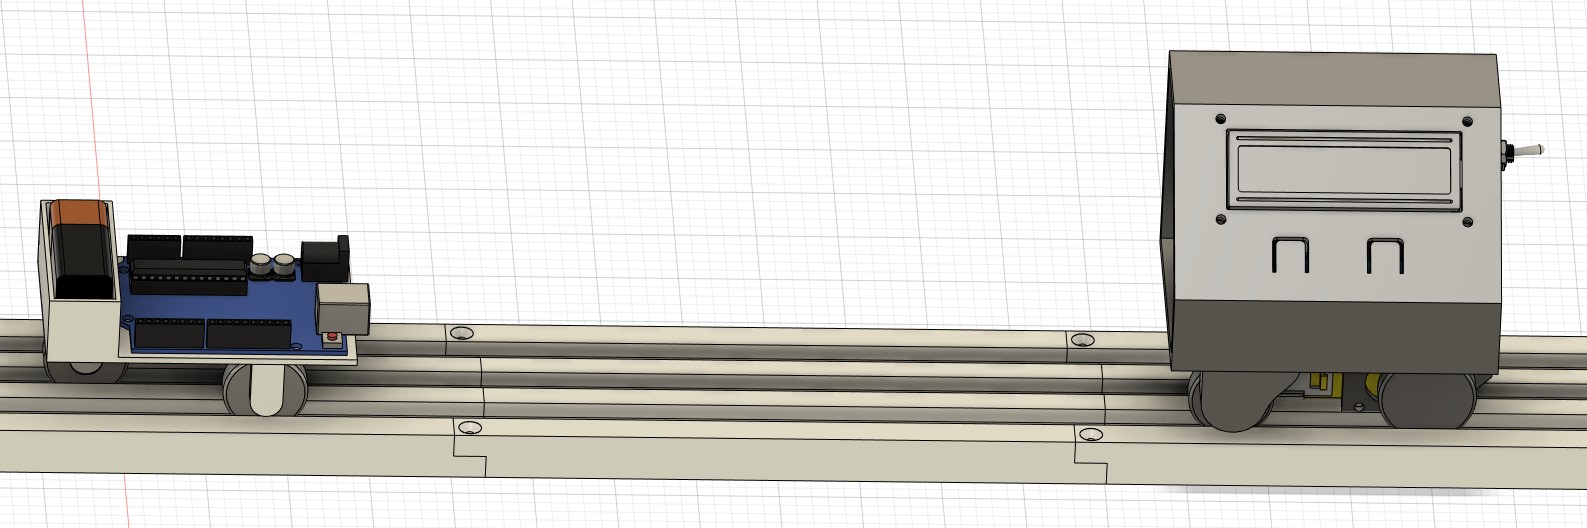
All parts were 3D printed in PLA. One kit consisted of one receiver cart, one transmitter cart, and three tracks to get the maximum rolling distance of around 60 centimeters.
You’ve read it all
Thanks for reading the article. If you have any questions, feel free to contact us.